When the Potomac River and local streams have excessive levels of nutrients (nitrogen and phosphorus) and sediment, it can make our waters unsafe to swim in and harm wildlife and plants.
Encouragingly, levels of nitrogen, phosphorus, and sediment have been decreasing in the Potomac River since 1985, with progress varying by source and state. Pollution flowing into the Potomac from agriculture, wastewater treatment plants, and point sources is on the decline.
Not all is well with our Nation’s River, however. Polluted urban runoff – the only growing source of pollution to the Potomac River and Chesapeake Bay – threatens to undo decades of restoration progress.
The Potomac River is part of the Environmental Protection Agency’s (EPA) largest regional cleanup plan, which targets the entire Chesapeake Bay.
The EPA created goals for the reduction of nitrogen, phosphorus, and sediment in the Potomac and other Bay rivers by setting a total maximum daily load — or TMDL — by state and source. The EPA tracks the flow of pollutants by using modeled estimates of pounds per year saved by best management practices (BMPs). States must meet the goals by 2025; an interim check on progress is slated for 2017. The charts below show the EPA’s current pollution estimates against the 2025 targets.
We included a United States Geological Survey (USGS) dataset understand the actual pollution loads observed at a non-tidal River Input Monitoring (RIM) station at Chain Bridge on the Potomac River. The RIM station at Chain Bridge is located just upstream from Washington, DC, and therefore pollution from Washington, DC does not pass by the monitoring station and is not measured by this data. Nonetheless, a comparison of the non-tidal water quality data (USGS) to the watershed-wide modeled data (EPA) is helpful in assessing pollution trends and gives us a fuller picture of the river’s health.

Previous Grade: A-
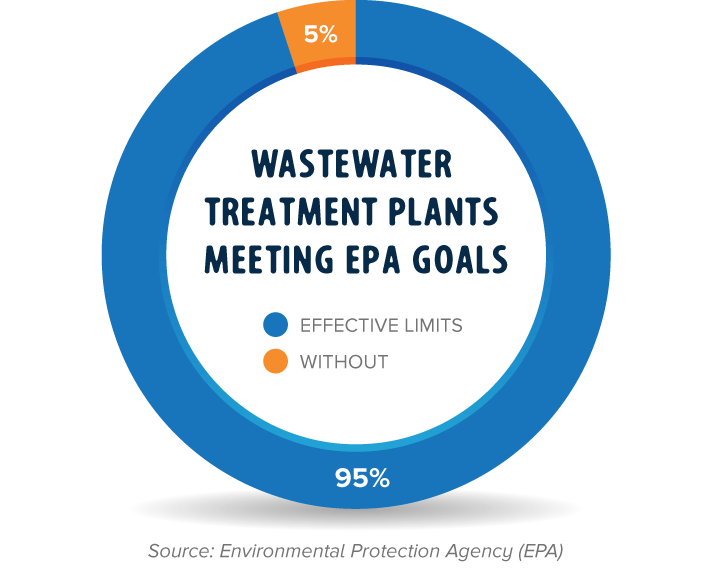
Wastewater treatment plant discharges are a primary source of pollution to the Potomac River. Between 2012 and 2015, the number and portion of wastewater treatment plants in the Potomac River basin that meet the EPA’s water quality standards increased by 13 percent. Ninety-five (95) percent of plants, or 99 facilities out of 104, have set limits that meet the EPA’s standards for emissions.

Previous Grade: B
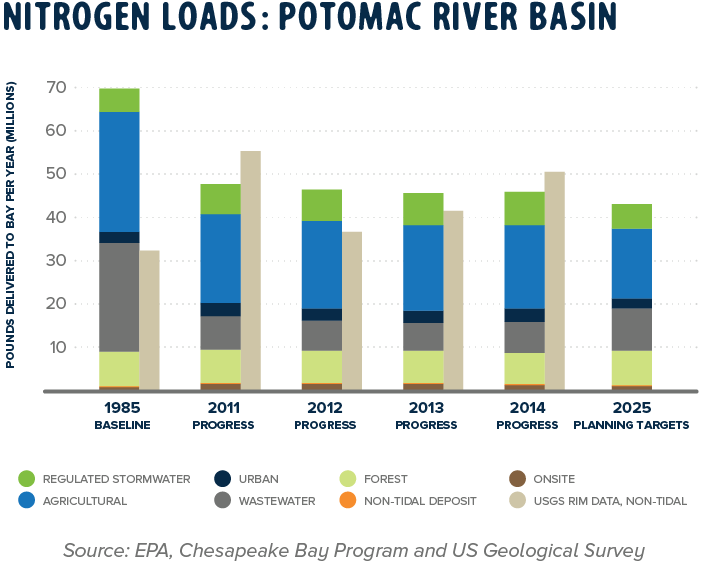
Nitrogen levels have improved in the long term (since 1985) and in the short term (since 2004). The EPA set a pollution reduction goal for nitrogen loads in the Potomac at 43.2 million pounds per year by 2025. USGS River Input Monitoring data from non-tidal waters confirmed an estimated nitrogen load of 50.6 million pounds per year, or 85.4 percent of the 2025 goal.
Though EPA estimates of nitrogen pollution have been relatively stable over the last three years, USGS data indicates it has been increasing in the non-tidal waters over the same period of time. It should be noted that nitrogen loads in the tidal waters, including Washington, DC, are not accounted for in the USGS data.
Nitrogen is found in some lawn fertilizers, atmospheric deposition, automobile exhaust, soil erosion, animal waste, and detergents.
Previous Grade: D
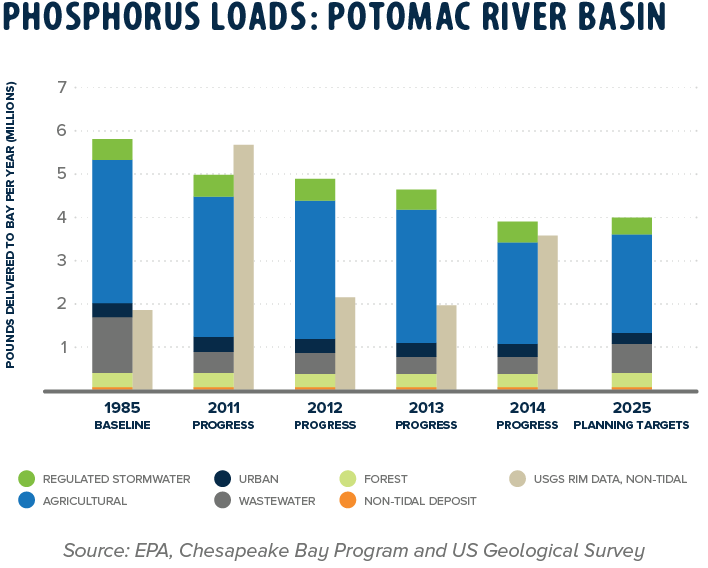
Phosphorus levels have improved in the long term (since 1985) and in the short term (since 2004). The EPA set a pollution reduction goal for phosphorus loads in the Potomac at 3.9 million pounds per year by 2025. In 2014, the EPA estimated phosphorus levels and USGS River Input Monitoring phosphorus data from non-tidal waters exceeded the 2025 goal. USGS non-tidal testing observed 3.58 million pounds of phosphorus per year, or 10.1 percent above of the 2025 goal.
Though EPA estimates of phosphorus pollution have been relatively stable over the last three years, USGS data indicates it has been increasing in the non-tidal waters over the same period of time. It should be noted that phosphorus loads in the tidal waters, including Washington, DC, are not accounted for in the USGS data.
Phosphorus is found in some lawn fertilizers, atmospheric deposition, automobile exhaust, soil erosion, animal waste, and detergents.
In 2010, Virginia and Maryland joined 14 states in passing a ban on the sale of detergents with phosphates. Virginia and Maryland have also enacted legislation that bans or extremely limits phosphorus in lawn fertilizers.

Previous Grade: B-
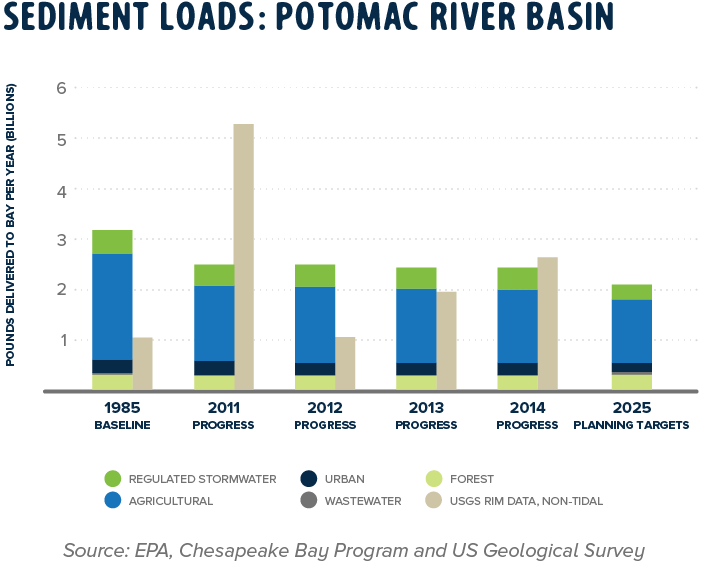
Sediment levels have improved in the long-term (since 1985) and in the short-term (since 2004). The EPA set a pollution reduction goal for sediment loads in the Potomac at 2.075 billion pounds per year by 2025. USGS River Input Monitoring data from non-tidal waters confirmed an estimated sediment load of 2.650 billion pounds per year, or 78.3 percent of the 2025 goal.
Though EPA estimates of sediment pollution have been relatively stable over the last three years, USGS data indicates it has been increasing in the non-tidal waters over the same period of time. It should be noted that sediment loads in the tidal waters, including Washington, DC, are not accounted for in the USGS data.
Shoreline erosion occurs naturally in river systems, but excessive erosion poses a dangerous threat to water quality, fish health, and underwater vegetation. Stream bank erosion is propelled by wet weather events and land use changes from agriculture, deforestation, and urban runoff. Sediment and floatables are contributed by channel erosion, street debris, lawns, driveways, roads, construction activities, atmospheric deposition, and drainage.
Improvements in sediment pollution levels can take years or even decades to observe because “legacy sediment” moves slowly downstream. Legacy sediment is stored in streams or floodplains. During storms, it is re-suspended, transported downstream, and redeposited.